Artículos
La influencia de la significación vital y el apoyo social en la resiliencia en Argentina, Colombia, Indonesia y España
La influencia de la significación vital y el apoyo social en la resiliencia en Argentina, Colombia, Indonesia y España
Ehquidad: La Revista Internacional de Políticas de Bienestar y Trabajo Social, núm. 21, pp. 161-184, 2024
Asociación Internacional de Ciencias Sociales y Trabajo Social
Recepción: 16 Mayo 2023
Revisado: 05 Septiembre 2023
Aprobación: 23 Septiembre 2023
Publicación: 20 Enero 2024
Resumen: Uno de los propósitos fundamentales del ser humano es desarrollar una vida plena y significativa. Entre las fuentes principales para lograr esa significación se halla el apoyo social. La significación vital es esencial porque, además, contribuye a conseguir el afrontamiento resiliente de las adversidades que se producen a lo largo de la existencia. Este es un tema de investigación relevante para el Trabajo Social y otras ciencias sociales. El objetivo de esta investigación es confirmar la relación entre la significación vital, el apoyo social y la resiliencia, ver si se dan diferencias significativas entre países y probar una serie de escalas. Con ese motivo, 1.500 participantes de Argentina, Colombia, España e Indonesia completaron un cuadernillo con la Medida de Vida Significativa (MLM) de Morgan y Farsides (2009a, 2009b), la Encuesta de Apoyo Social (MOS-SSS) de Sherbourne y Stewart (1991) y la Escala de Resiliencia (CD-RISC) de Connor-Davidson (2003). El modelo estructural muestra que el apoyo social influye tanto en la significación vital como en la resiliencia ante la adversidad. También se observa una influencia directa del apoyo social sobre la resiliencia. Los niveles de significación vital, resiliencia y apoyo social son muy similares entre Argentina, Colombia y España, no así con Indonesia. Las escalas tienen buenas propiedades psicométricas. El análisis factorial encuentra una estructura de cinco factores para la escala de vida significativa y dos factores para la de apoyo social, mientras que la escala de resiliencia se comporta como unifactorial.
Palabras clave: Vida significativa, Significación vital, Apoyo social, resiliencia, Bienestar.
Abstract:
One of the fundamental purposes of the human being is to develop a full and meaningful life. Among the main sources to achieve this meaning in life is social support. Meaning in life is essential because, in addition contributes to achieving resilient coping with adversities that occur throughout life. This is a relevant research issue for social work and other social sciences. The objective of this research is to confirm the relationship between meaning in life, social support and resilience, see if there are significant differences between countries and test a series of scales. It involved 1,500 participants from Argentina, Colombia, Spain and Indonesia, who completed a booklet comprising Morgan and Farsides' (2009a, 2009b) Meaningful Life Measure (MLM), the Medical Outcome Study-Social Support Survey (MOS-SSS) by Sherbourne and Stewart (1991) and Connor-Davidson’s (2003) Resilience Scale (CD-RISC). The structural model shows that social support influences both meaning in life and resilience in the face of adversity. A direct influence of social support on resilience is also observed. The levels of meaning in life and resilience, as well as perceived social support are very similar between Argentina, Colombia and Spain, not so with Indonesia. The scales used have good psychometric properties. The factor analysis finds a five-factor structure for the meaning in life scale and two factors for the social support scale, while the resilience scale behaves as a unifactorial one.
Keywords: Meaningful Life, Meaning in life, Social Support, Resilience, well being.
1. INTRODUCTION
Several authors have examined the relationships between meaning in life, social support and resilience. To do so, they have used various instruments, which they have tested in relation to factorial structure, and which we will now briefly review.
Relationship between Social Support (SS) and Resilience (R)
There are several studies like those of Horton and Wallander (2001), Malçoc and Yalçin (2015) that found a relationship between social support and resilience.
Wang and Xu (2017), with parents who had lost their only child in the 2008 Wenchuan earthquake, found that social support acted as a mediator between resilience and quality of life.
Also, Lee et al (2021) found that there was a relationship between social support and resilience and determined that it had an impact on the mental health of different age groups during the COVID-19 pandemic.
Relationship between Social Support and Meaning in life (MiL)
Delle Fave et al. (2011) confirmed that family and interpersonal relationships significantly explain both happiness and life meaningfulness. Kleftaras and Psarra (2012) observed that those who had a partner and participated in various social activities reported high levels of life meaningfulness.
Vaziri and Lofti (2017) had claimed that greater perceived social support was related to a deeper sense of life. Also, Liu, Di, Shi and Ma (2021) showed that relationship with adolescents.
Relationship between Meaning in life and Resilience
Weathers et al (2016) and Southwick and Charney (2018) identified that meaning in life is fundamental to resilience.
Weber et al (2019), with tornado survivors, found that life meaningfulness positively predicted resilience and post-traumatic growth. Also, Tsibidaki (2021) noted that connection between meaning in life and resilience in families with members with special educational needs and disability during COVID-19 pandemic in Greece.
Relationship between MiL, SS and R
There is an interactive relationship between the three constructs. Du et al. (2017) consider that meaning in life might be more effective when people have access to resources, which make resilience possible, such as support from family or school.
Machielse (2018) found social contacts and social support contribute substantially to the ability to give meaning in life. In turn, the experience of a meaning in life enhances people's resilience.
Having social support is a basic key to resilient personal recovery from adverse situations (Apriani y Listiyandini, 2019; Lozano et al., 2020).
Zhang, Jiang, Wang, Zheng y Wang (2023) showed this relationship of the three constructs in Covid patients in China.
Factor structure of Meaning in life scale
Among the various studies, those carried out by Morgan and Farsides (2009a) stand out. These authors conducted three studies with the aim of developing an appropriate measure. In the first of these, they used the PIL (Purpose in Life by Crumbaugh and Maholick, 1969), LRI (Life Regard Index by Battista and Almond, 1973), and PWB-P (Psychological Wellbeing Purpose Scale by Ryff, 1989) scales with a sample of 200 subjects. They carried out an exploratory factor analysis of these scales and identified five factors for meaning in life.
In the second study, they constructed and applied the MLM scale to 211 subjects. Using confirmatory factor analysis (CFA), the five-factor approach was found to be the one with the best overall goodness of fit.
In their third study, with 91 subjects, the authors tested the validity of the scale by comparing it with the PIL, the LRI and the PWB-P ones. The high correlations observed between the MLM and these scales demonstrated the existence of good convergent validity.
In a subsequent investigation, Morgan and Farsides (2009b) again tested the factor structure with a sample of 249 subjects, validating the five-factor model:
1). Purposeful Life which represents the sense of having clear goals and objectives, 2). Accomplished Life that indicates the degree to which these personal goals are being achieved, 3). Principled Life involves having a "personal philosophy" or reflective framework that helps to understand life, 4). Exciting Life manifests an enthusiastic orientation that values one's own life as interesting and stimulating, 5). Valued Life is one that appreciates the inherent importance and value of one's own life.
More recently, Morgan and Robinson (2012) and Di Fabio (2014) identified the same multidimensional structure.
Factor structure of the Social Support Scale
One of the most widely implemented instruments of social support is the MOS-SSS (Medical Outcomes Study-Social Support Survey). It was developed by Sherbourne and Stewart (1991). Initially, a five-factor structure was proposed: 1) Emotional support, 2) Informational support, 3) Tangible support, 4) Positive social interaction and 5) Affectionate support.
However, in their initial research with 2,987 people, they determined the existence of four factors (emotional/informational, tangible, affective and positive social interaction). Nonetheless, the evidence of the delimitation of social support from these four factors has been conflicting.
Thus, some studies have proposed other structures. Costa et al. (2007), for example, isolated three factors: emotional/informational support (with positive social interaction), affective support and instrumental support.
Beutel et al (2017) confirmed two components (emotional and tangible social support), as did Martínez et al (2014).
Factor structure of the Resilience scale
As for measurement of the resilience construct, the tool developed by Connor and Davidson in 2003 stands out. The CD-RISC scale was originally applied to a sample of 828 people. They found a five-factor structure: The first is related to personal competence, tenacity, and the pursuit of high standards. The second concerns tolerance of negative affect and reinforcing effects of stress. The third relates to positive acceptance of change and secure relationships. The fourth concerns control and the fifth spiritual influences.
However, other factor structures have been observed. Thus, the studies conducted by Gras et al (2019) confirmed its unidimensional character. A similar result was found by García-León et al (2019).
2. METHOD
A total of 1,500 participants from Argentina, Colombia, Spain and Indonesia took part in this research. Of the total, 656 were university students and 844 were family members of university students. The actual sample (missing persons removed) was 1,366 persons and per country consisted of Colombia with 320; Spain with 487; Argentina with 309 and Indonesia with 250 persons.
The average age of the women was 29.17 years old and the average age of men was 34.51 years old. In terms of their level of education, 2.5% had incomplete primary education, 9.1% had completed primary and secondary education, 25% had completed high school or vocational training, 16.5% had completed a degree and 46.7% were currently studying at university level.
2.1. Procedure
The students were asked to request the collaboration of some of their family members. The students answered the questionnaire booklet in paper format in the classroom and were given a copy of the booklet to be completed by a family member at home in the following days. The students were also informed of the deadline for returning the instrument and the place of receipt of the instrument by the respective family members. Participation in the study was voluntary, after accepting informed consent, and no incentives were offered. Permission was sought from the academic authorities of each of the participating universities.
2.2. Instruments
A booklet was published in Spanish (for Argentina, Colombia and Spain), and English and Indonesian (for Indonesia) with the following scales:
· Meaning in Life Scale -Meaningful Life Measure (MLM)- by Morgan and Farsides (2009a, 2009b).
· Medical Outcome Study - Social Support Survey (MOS-SSS) by Sherbourne and Stewart (1991).
· Resilience Scale - Connor-Davidson Resilience Scale (CD-RISC) by Connor and Davidson (2003).
· Self-designed socio-demographic data questionnaire.
In relation to these scales, the following comments should be made:
· Meaningful Life Measure (MLM) consists of 23 items with statements, which are scored from 1 to 10, from the lowest to the highest degree of agreement. For the translation and adaptation of the scale into Spanish, we followed the indications of Muñiz et al (2013). To check the language correspondence of the items, a double translation was carried out: from the original English version into Spanish and Indonesian and then back into English. The two translations of the instrument were carried out by two independent professionals.
· The Medical Outcome Study - Social Support Survey (MOS-SSS) consists of 19 items with respondents indicating the frequency of support received in terms of help in cases of illness, being able to talk to someone about personal problems, receiving advice, trusting or having a good time with someone (1 being never and 5 always). It was adapted and translated from English into Spanish and Indonesian, following the same procedure as above.
· Connor-Davidson Resilience Scale (CD-RISC). It consists of 10 items and is scored from 1 (never) to 5 (always). It was adapted and translated from English into Spanish and Indonesian, following the same procedure as above.
· Demographic scale: Among the data included were age, sex, household income, educational level, marital status, employment status, continuing education, support from primary and secondary networks, third sector involvement, health status, etc.
3. RESULTS
Data analysis
For each of the three scales, we first show the descriptive statistics, internal consistency, and omega hierarchical (Schmid and Leiman, 1957) of the full scale (general factor). To determine the non-differential item functioning of each scale by country, a Differential item functioning (DIF) analysis (Chalmers, 2012; Choi, 2016) was carried out for each of the scales using the item exclusion criterion value of change of statistic R. greater than 0.1 between the four countries.
Next, a confirmatory factor analysis (CFA) was conducted with the factorial solution initially proposed by the authors (with the items that did not have a significant DIF by country) with a configural model (of free estimation in each of the four countries). Later a constrained model (metric invariance) was used where loadings of the indicators in each of the factors were forced to be equal in the four countries. The fit of the estimated measurement models was performed using the maximum likelihood estimator (ML) and the Xi-square fit indices NFI, NNFI, and RMSA.
The recommended values for adequate fit were around .90 for the NFI, NNFI, and CFI indexes (Kline, 2011[j3]). The best fitting models obtained RMSA values under .07 with an upper 90% CI lower than 0.1 (Hu and Bentler, 1999).
For each of the three scales used, a hypothesis test was carried out to see whether or not the constrained model was equal to the configural one (metric invariance contrast) by comparing nested models.
Once the measurement models had been defined, estimated, and confirmed, the factor scores of participants were calculated for each of the scales and subscales. With these variables, the structural equation model estimates of the influence of social support factors on meaning in life and resilience were calculated. All the analyses were carried out with free software R, and more specifically with the psych (Revelle, 2019), lavaan (Rosseel, 2012), mirt (Chalmers, 2012) and lordif (Choi, 2016) packages (R Core Team, 2016; Rosseel, 2012) using ULLRToolbox (Hernández-Cabrera and Betancort, 2016).
Results
Meaningful Life Measure
Descriptive statistics
| Meaningful Life Measure | |||||||||||||
| Argentina | Colombia | Indonesia | Spain | ||||||||||
| mean | sd | α(Cr.) | mean | sd | α(Cr.) | mean | sd | α(Cr.) | mean | sd | α(Cr.) | ||
| ML1 | mlm1 | 6.4 | 1.9 | 0,76 | 6.9 | 2.3 | 0,80 | 6.7 | 1.8 | 0,78 | 6.5 | 1.9 | 0,83 |
| mlm2 | 6.6 | 2.4 | 7.7 | 2.2 | 6.6 | 1.8 | 6.2 | 2.3 | |||||
| mlm3 | 6.0 | 2.2 | 7.0 | 2.2 | 6.4 | 1.7 | 6.0 | 2.1 | |||||
| mlm4 | 7.0 | 1.9 | 7.8 | 2.0 | 6.6 | 1.7 | 7.1 | 2.0 | |||||
| ML2 | mlm6 | 7.2 | 2.1 | 0,81 | 7.5 | 2.3 | 0,88 | 6.7 | 1.6 | 0,82 | 7.5 | 2.0 | 0,90 |
| mlm7 | 7.5 | 2.1 | 7.6 | 2.2 | 6.8 | 1.6 | 7.7 | 2.0 | |||||
| mlm8 | 6.8 | 1.9 | 7.2 | 2.0 | 6.5 | 1.7 | 7.4 | 1.8 | |||||
| mlm10 | 7.6 | 2.0 | 7.7 | 2.1 | 6.8 | 1.6 | 7.7 | 1.8 | |||||
| ML3 | mlm11 | 7.4 | 2.0 | 0,80 | 7.8 | 2.0 | 0,86 | 6.5 | 1.7 | 0,81 | 7.7 | 1.8 | 0,86 |
| mlm12 | 6.7 | 2.4 | 7.4 | 2.2 | 6.6 | 1.7 | 7.4 | 1.9 | |||||
| mlm13 | 7.9 | 1.8 | 8.1 | 2.0 | 6.9 | 1.5 | 8.0 | 1.6 | |||||
| mlm14 | 6.8 | 2.3 | 7.6 | 2.3 | 6.7 | 1.5 | 7.0 | 2.3 | |||||
| mlm15 | 8.0 | 1.7 | 8.1 | 1.9 | 6.9 | 1.6 | 7.9 | 1.6 | |||||
| ML4 | mlm16 | 7.8 | 2.1 | 0,73 | 8.4 | 1.8 | 0,71 | 7.0 | 1.7 | 0,79 | 7.8 | 1.9 | 0,83 |
| mlm17 | 7.5 | 2.0 | 8.1 | 1.8 | 7.0 | 1.8 | 7.7 | 1.9 | |||||
| mlm18 | 7.6 | 2.1 | 8.2 | 2.0 | 6.9 | 1.6 | 7.6 | 2.0 | |||||
| mlm19 | 7.3 | 2.6 | 7.1 | 2.8 | 5.7 | 1.8 | 7.8 | 2.2 | |||||
| ML5 | mlm20 | 8.4 | 1.9 | 0,89 | 8.8 | 1.9 | 0,96 | 7.1 | 1.6 | 0,74 | 8.5 | 1.7 | 0,92 |
| mlm21 | 8.3 | 1.8 | 8.7 | 1.8 | 7.3 | 1.6 | 8.2 | 1.9 | |||||
| mlm22 | 8.4 | 1.9 | 8.7 | 1.8 | 7.4 | 1.5 | 8.5 | 1.8 | |||||
| mlm23 | 8.6 | 1.8 | 8.8 | 1.7 | 7.0 | 1.8 | 8.7 | 1.6 | |||||
As can be seen, in general, all items have high mean values with reliability coefficient subscales acceptable and similar between the countries. The omega hierarchical reliability index (Schmid and Leiman, 1957) for a general factor gives a value of 0.86 indicating, therefore, the existence of a general factor in the five subscales. Items 5 and 9 were excluded because of a flagged DIF between countries.
Confirmatory Factor Analysis (CFA)
The factor structure proposed by the authors was submitted to a CFA (23 items in five factors plus a general second-order factor). First, the configural model was estimated using a MiL estimator (independent parameter estimation for each country). This model estimation, as expected, resulted in appropriate factor loading for each factor as well as on the overall factor (with mean standardized second order loading values of 0.8 (0.74-0.86 minimum and maximum respectively)). The configural model estimation showed a good fit to the data (χ.(720, N=1370) =1657.3 p < 0.001; NFI=0.91; NNFI=0.94; CFI=0.95 and RMSEA=0.062[0.058-0.066]. To check the metric invariance model across countries, a second constrained model was estimated forcing all lambda loadings values to be equal (between countries). The constrained model’s fit was almost identical to the configural one: χ .(780, N=1370)=1788.8 p < 0.001; NFI=0.90; NNFI=0.94; CFI=0.94 and RMSEA=0.061[0.058-0.065]. The metric invariance test between countries was carried out through the nested likelihood ratio test (Bentler and Bonnet, 1980). The test showed a significant difference between the two models (Dc.(Ddf=60)=131.5 p <0.001). Following Newsom (2015), a standardized magnitude of the difference between nested models was calculated. The algorithm involves calculating (w) the root of the ratio resulting from dividing the increase of the statistic Dc. by the product of the differential of degrees of freedom (Ddf) and the sample size (N). Values lower than 0.1 are considered small, 0.1-0.3 medium, and greater than 0.3 large differences. The value obtained for the above significant comparison was 0.04. Thus, we can consider an invariant metric structure for the scale (between countries).
Medical Outcome Study (MOS)
Descriptive statistics
As can be seen in Table 2, items 8 and 9 were omitted from the analysis because they were problematic in the DIF analysis by country. Cronbach's alphas and means are high.
| Medical Outcome Study | |||||||||||||
| Argentina | Colombia | Indonesia | Spain | ||||||||||
| mean | sd | α(Cr.) | mean | sd | α(Cr.) | mean | sd | α(Cr.) | mean | sd | α(Cr.) | ||
| MO1 | mos1 | 3.8 | 1.2 | 0.82 | 3.7 | 1.2 | 0.80 | 3.2 | 1.1 | 0.82 | 4.2 | 1.0 | 0.86 |
| mos4 | 3.8 | 1.2 | 3.8 | 1.2 | 3.5 | 1.1 | 4.3 | 1.0 | |||||
| mos11 | 3.9 | 1.2 | 3.7 | 1.2 | 3.6 | 1.0 | 4.2 | 1.0 | |||||
| mos14 | 3.7 | 1.2 | 3.5 | 1.2 | 3.4 | 1.0 | 4.1 | 1.0 | |||||
| MO2 | mos2 | 4.3 | 0.9 | 0.91 | 3.7 | 1.1 | 0.94 | 3.4 | 0.9 | 0.92 | 4.4 | 0.9 | 0.95 |
| mos3 | 4.1 | 1.0 | 3.7 | 1.1 | 3.4 | 0.9 | 4.3 | 0.9 | |||||
| mos5 | 4.3 | 1.0 | 4.1 | 1.1 | 3.5 | 0.9 | 4.5 | 0.8 | |||||
| mos6 | 4.3 | 0.9 | 3.8 | 1.1 | 3.3 | 0.9 | 4.4 | 0.7 | |||||
| mos7 | 3.8 | 1.0 | 3.6 | 1.1 | 3.4 | 0.9 | 4.1 | 0.9 | |||||
| mos10 | 3.9 | 1.1 | 3.6 | 1.2 | 3.5 | 0.9 | 4.2 | 0.9 | |||||
| mos12 | 3.6 | 1.2 | 3.6 | 1.1 | 3.3 | 0.9 | 4.0 | 1.0 | |||||
| mos13 | 3.9 | 1.0 | 3.6 | 1.2 | 3.4 | 0.9 | 4.2 | 0.9 | |||||
| mos15 | 3.8 | 1.2 | 3.4 | 1.3 | 3.3 | 1.0 | 4.2 | 1.0 | |||||
| mos16 | 3.8 | 1.1 | 3.6 | 1.1 | 3.3 | 1.0 | 4.1 | 1.0 | |||||
| mos17 | 4.3 | 0.9 | 3.8 | 1.1 | 3.6 | 0.9 | 4.4 | 0.8 | |||||
| mos18 | 3.6 | 1.1 | 3.5 | 1.1 | 3.4 | 0.9 | 4.1 | 1.0 | |||||
| mos19 | 4.2 | 1.1 | 4.0 | 1.1 | 3.5 | 0.9 | 4.4 | 0.9 | |||||
A two-factor structure was also estimated, because the original four-factor structure proposed by the authors was problematic. Many indicators involved more than one factor. All items have similar means and standard deviations as well as good reliability values (all over 0.75) across subscales and countries. The omega hierarchical for a general factor was 0.84.
Confirmatory Factor Analysis (CFA)
The configural two factor model gave an acceptable fit to the data (χ.(412, N=1370)=1534.1 p < 0.001; NFI=0.91; NNFI=0.91; CFI=0.93 and RMSEA=0.089[0.084-0.094]. Likewise, the fit of the constrained model between countries was very similar to the configural one: χ.(457, N=1370)=1623.8 p < 0.001; NFI=0.90; NNFI=0.92; CFI=0.93 and RMSEA=0.086[0.081-0.09]. The metric invariance test produced a significant result with Dc.(Ddf=45)=89.8 p < 0.001, but the standardized magnitude of the difference (w=0.038) suggests an irrelevant or minor difference between both models.
Items 2, 3, 5, 6, 7, 7, 10, 10, 12, 13, 15, 16, 17, 18 and 19 load on the main factor (emotional, affective and informational support). Items 1, 4, 11 and 14 represent material or instrumental support.
Resilience Scale
Descriptive statistics
Table 3 depicts descriptive statistics for the ten items of the scale. Cronbach’s alphas for the unidimensional scale between countries were high and similar. In the same way, the omega hierarchical was 0.87.
The mean resilience scores for each of the items were moderately high. Their Cronbach's alphas were good.
Confirmatory Factor Analysis (CFA)
The configural CFA model give high and significant loadings on all items of the resilience general factor and acceptable fit indexes: χ.(136, N=1370)=373.2 p < 0.001; NFI=0.91; NNFI=0.92; CFI=0.94 and RMSEA=0.071[0.063-0.080]. The constrained model across countries also fits moderately well to the data: χ.(163, N=1370)=440.3 p < 0.001; NFI=0.90; NNFI=0.93; CFI=0.93 and RMSEA=0.071[0.063-0.079]. Finally the metric invariance comparison between both models was significant: Dc.(Ddf=27)=67.1 p < 0.001 but as with the previous scale the standardized magnitude of the difference was minor (w=0.042).
Structural Model
Once all the measurement models were estimated, the participants' factor scores were estimated from each of the measurement models for every factor of interest.: Resilience (RES), Instrumental Social Support (ISS), General Social Support (GSS) and Meaning in Life (MiL).
| Resilience | |||||||||||||
| Argentina | Colombia | Indonesia | Spain | ||||||||||
| mean | sd | α(Cr.) | mean | sd | α(Cr.) | mean | sd | α(Cr.) | mean | sd | α(Cr.) | ||
| RES | res1 | 3.70 | 0.90 | 0.80 | 3.89 | 0.96 | 0.86 | 2.75 | 0.81 | 0.92 | 3.87 | 0.96 | 0.83 |
| res2 | 3.17 | 0.90 | 3.81 | 1.03 | 2.61 | 0.81 | 3.39 | 0.92 | |||||
| res3 | 3.62 | 1.11 | 3.91 | 1.03 | 2.49 | 0.88 | 3.78 | 1.04 | |||||
| res4 | 3.28 | 1.12 | 3.65 | 1.01 | 2.76 | 0.85 | 3.46 | 0.97 | |||||
| res5 | 3.74 | 1.06 | 3.87 | 0.94 | 2.71 | 0.84 | 3.91 | 0.90 | |||||
| res6 | 3.85 | 0.92 | 4.09 | 0.91 | 2.83 | 0.88 | 3.99 | 0.79 | |||||
| res7 | 3.09 | 1.25 | 3.43 | 1.14 | 2.60 | 0.89 | 3.39 | 1.01 | |||||
| res8 | 2.98 | 1.28 | 3.32 | 1.17 | 2.65 | 0.92 | 2.99 | 1.09 | |||||
| res9 | 3.85 | 1.02 | 4.13 | 0.92 | 2.68 | 0.86 | 3.94 | 0.94 | |||||
| res10 | 3.36 | 1.19 | 3.75 | 1.11 | 2.58 | 0.85 | 3.50 | 1.02 | |||||
Table 4 shows the factors correlation matrix in the four countries.
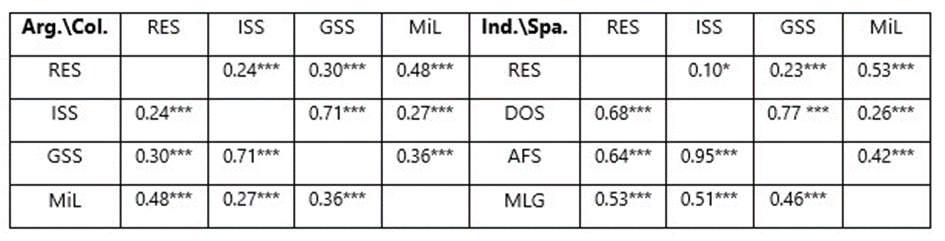
Tabla 4
Correlation matrix between factors scores (lower triangular Angentina and Indonesia, upper triangular Colombia and Spain)
Source: Own elaboration.
Once all the measurement models were estimated, participants' factor scores were estimated from each of the measurement models for every factor of interest: Resilience, Meaning in Life, Instrumental, and General Social Support. Table 5 shows the factors correlation matrix in the four countries.
| Argentina | Colombia | Indonesia | Spain | |||||||||||||
| unst | z | p | stan | unst | z | p | stan | unst | z | p | stan | unst | z | p | stan | |
| ISS →GSS | 0.52 | 17.37 | *** | 0.70 | 0.71 | 20.05 | *** | 0.81 | 0.76 | 41.91 | *** | 0.94 | 0.65 | 23.99 | *** | 0.78 |
| GSS→MiL | 0.48 | 6.08 | *** | 0.34 | 0.65 | 7.69 | *** | 0.46 | 0.33 | 4.26 | *** | 0.27 | 0.76 | 10.12 | *** | 0.49 |
| MiL→RES | 0.25 | 16.79 | *** | 0.42 | 0.25 | 16.79 | *** | 0.45 | 0.25 | 16.79 | *** | 0.40 | 0.25 | 16.79 | *** | 0.50 |
| GSS →RES | 0.09 | 1.7 | ns | 0 | 0.19 | 2.94 | ** | 0.24 | 0.00 | 0.07 | ns | 0.00 | 0.12 | 2.30 | * | 0.15 |
| RES →ISS | 0.11 | 0.71 | ns | 0 | -0.21 | -1.23 | ns | 0 | 0.93 | 6.81 | *** | 0.62 | -0.32 | -2.41 | * | -0.21 |
Figure 1 shows the path diagram of the proposed structural model.
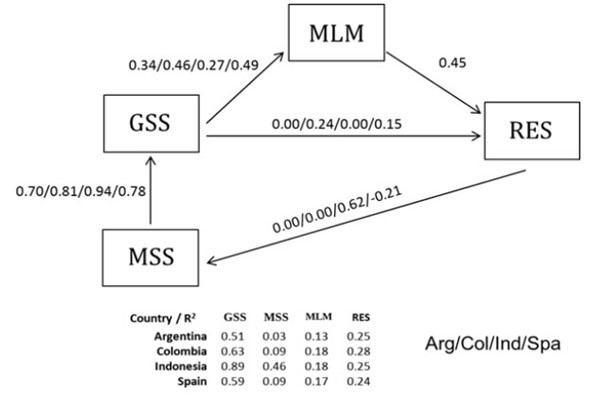
Figura 1
Path analysis (country values separated by slash) ISS (Instrumental Social Support), GSS (General Social Support), MiL (Meaning in Life), RES (Resilience).
Source: Own elaboration.
The configural model results in a very good fit to the data: χ2(4, N=1400)=8.95 p > 0.05; NFI=0.99; NNFI=0.98; CFI=0.99 and RMSEA=0.059[0.00-0.11]. The version of the structural model restricted to be the same between countries resulted in unacceptable adjustment indices. This indicates the need to release the necessary structural parameters (free estimation between countries) until acceptable adjustment rates are achieved. The fit was achieved when all effects (different values between countries) were released except the effect of meaning of life on resilience (set to be equal between countries): χ.(7, N=1400)=15.4 p < 0.05; NFI=0.99; NNFI=0.98; CFI=0.99 and RMSEA=0.059[0.017-0.099]. The likelihood ratio test between both models results in a nonsignificant contrast: Dc.(Ddf=3)=6.49 p > 0.05.
Table 5 includes the values of the estimated structural parameters for the constrained model and Figure 1 also shows in a clearer, more summarized way the structural effect paths with the standardized values for the four countries. In it, we can see how the instrumental social support factor (ISS) has a strong and positive influence on the general social support factor (GSS). This effect, being high for all countries, is especially notable in Indonesia (β =0.94). The influence of social support on meaning in life (MiL) is also different per country. Thus, we can see how the lowest influence (β=0.27) occurs in Indonesia followed by Argentina (β =0.34), while Spain and Colombia present medium average values (β =0.46, 0.49 respectively). The direct effect of general social support on resilience is null in Argentina and Indonesia, while in Spain and Colombia it is significant but of low relevance. The only effect that is identical for all four countries is the meaning in life factor (MiL) on resilience with a standardized value of β =0.40. For the model to fit, it was necessary to release the effect path of resilience on the instrumental social support factor (ISS). As can be seen, this effect was null for Argentina and Colombia and low although negative for Spain. The value for Indonesia was positive and moderately high (β =0.62). The same figure shows the proportion of variance that the model is explaining for each of the factors studied. The factor with the greatest variance is general social support (GSS), which is strongly linked to the amount of support in the event of health-related difficulties (average of R.= 0.65).
It is in Indonesia where this explained variance is highest at 89%. At the same time, it is in this country where the instrumental social support factor (ISS) has the greatest explained variance, 46%, compared to almost zero variance for the rest of the countries. The mediating factor Meaning in life (MiL) achieves a similar and moderate explained variance in all countries. Finally, we also see that the explained variance of resilience (RES) is similar among the countries with a value of 25%.
Comparison of factors scores means (ANOVAS)
For the four factors studied, four analyses of variance (ANOVA) were carried out including factors like the sex, country and age of the participant as a covariate variable (ANOVA sex x country (2 x 4). To simplify the visualization of the distances between the means of the four factors (N(0,1)) these were transformed into a new metric N(100,15).
Of the four ANOVAs conducted, there was a significant effect of all factors (sex, country, and sex x country) only for the factor General social support (GSS). However, the only non-spurious effect size η.(p)> 0.015) was for the country main effect. For the rest of the outcomes, the only significant effect was for the country factor. The age covariant variable was not significant for any test (p > 0.05).
Table 6 shows the values of the F statistic for the main country effect in the four factors studied as well as the means and sd. of the four outcome variables studied. The largest country-linked effect size is found in Resilience (η.(p) = 0.30) and the smallest for Meaning in Life (η.(p) = 0.07). The explained variance values for the other two factors (ISS and GSS) are 0.14 and 0.11, respectively.
| Country | GSS | ISS | MiL | RES |
| F(3,1392) = | 76.75 ***, η2(p)= 0.14 | 60.21 ***, η2(p)= 0.11 | 35.61 ***, η2(p)= 0.07 | 195.27 ***, η2(p)= 0.30 |
| Argentina (m/sd) | 100.92 (13.19) | 99.77 (14.74) | 99.82 (13.63) | 100.44 (12.56) |
| Colombia (m/sd) | 96.20 (15.78) | 97.34 (14.93) | 104.67 (16.22) | 106.74 (13.61) |
| Indonesia (m/sd) | 90.81 (14.11) | 91.77 (14.41) | 92.14 (12.26) | 83.44 (13.14) |
| Spain (m/sd) | 106.23 (12.89) | 105.76 (13.04) | 101.02 (14.77) | 103.56 (11.97) |
| GSS\ISS | Arg. | Col. | Ind. | Spa. | MiL\RES | Arg. | Col. | Ind. | Spa. |
| Arg. | * | *** | *** | Arg. | *** | *** | ns | ||
| Col. | *** | *** | *** | Col. | *** | *** | *** | ||
| Ind. | *** | *** | *** | Ind. | *** | *** | *** | ||
| Spa. | *** | *** | *** | Spa. | ns | *** | *** |
Table 7 shows that the six pair-to-pair post-hoc comparisons between countries (with Hochberg correction against Type I error Hochberg, 1988) were significant (p < 0.001) for almost all comparisons. As far as resilience is concerned, we can see that Indonesia (with the lowest value) is significantly lower compared with the other countries. Colombia presents the highest average value and higher than the rest of the countries (p < 0.001). Spain has the second highest average, although it is statistically equal to Argentina (p > 0.01). In both general and instrumental social support, Spain has the highest values and significantly higher than in the other three countries. Indonesia has the lowest value of the four. As far as meaning in life is concerned, Indonesia continues to be the country with the lowest average value and Colombia with the highest. Spain and Argentina present equal values in this outcome.
Finally, it should be noted that the influence of the remaining socio-demographic factors on the study constructs is minimal. No relevant loadings are observed.
4. DISCUSSION
The three scales used show good psychometric properties (especially with regard to hierarchical omega and goodness of fit). The CFA of each scale found no significant differences between the configural model and the invariance model between countries. The MLM has a high Cronbach's alpha and hierarchical omega. There are two items (items 5 and 9) that distort the results and were removed. The CFA finds no relevant differences between the two models and confirms a five-factor structure.
The MOS-SSS raises difficulties with the original four-factor structure. A two-factor structure is validated. All items have similar means and sd. Items 3 and 9 are eliminated due to the noise they generate. There is good inter-rater and inter-country reliability. The hierarchical omega is 0.84. The CFA does not detect differences between the configural and invariance model and determines the existence of two factors (general social support and instrumental social support).
The Resilience scale has similar Cronbach's alphas for all countries. It is shown to be unifactorial. The comparison between both models does not show any notable differences. It presents a hierarchical omega of 0.87.
As far as structural models are concerned, the comparison between the configural and the invariance model does not reveal any significant differences. It is confirmed that social support affects meaning in life and resilience, coinciding with the results of Zhang, Jiang, Wang, Zheng y Wang (2023). The Analysis of Variance (ANOVAS) found no relevant effects. Of the four ANOVAs conducted, there was a significant effect of all factors (sex, country, and sex x country) only for the factor General social support. However, the only non-spurious effect size η2(p)> 0.015) was for the country main effect. Although relevant differences were expected between participants from the four countries, no relevant differences were found.
As far as the limitations of this study are concerned, the following points should be noted. First, the sample size should be larger, given the participation of four countries. In addition, the distribution by age and educational level should be more balanced.
Interpretation
1. Social support influences meaning in life and resilience.
2. The scales of meaning in life, resilience and social support are valid and reliable and perform very robustly.
3. The five-factor first-order (and one second-order) structure of Meaningful Life Measure (MLM) by Morgan and Farsides is confirmed.
4. The Resilience scale (Connor-Davidson) is unifactorial and the Social Support scale (Sherbourne and Stewart) is bifactorial.
5. No socio-demographic variable (age, gender, educational level, income, etc.) was found to have a significant impact on the main constructs.
6. Surprisingly, the levels of meaning in life and resilience, as well as perceived social support are very similar between Argentina, Colombia and Spain, not so with Indonesia.
5. REFERENCES
Apriani F. and Arruum Listiyandini R. (2019). Kecerdasan emosi sebagai prediktor resiliensi psikologis pada remaja di panti asuhan. Jurnal Psikologi Indonesia, 8(2), 325-339. https://doi.org/10.30996/persona.v8 i2.2248
Battista, J., and Almond, R. (1973). The development of meaning in life. Psychiatry, 36, 409-427. https://doi.org/10.1080/00332747.1973.11023774
Bentler, P. M., and Bonett, D. G. (1980). Significance tests and goodness of fit in the analysis of covariance structures. Psychological bulletin, 88(3), 588. 10.1037/0033-2909.88.3.588
Beutel ME, Brähler E, Wiltink J, Michal M, Klein EM, Jünger C, et al. (2017) Emotional and tangible social support in a German population-based sample: Development and validation of the Brief Social Support Scale (BS6). PLoS ONE 12(10): e0186516. https://doi.org/10.1371/journal.pone. 0186516
Chalmers, R. P. (2012). "mirt: A Multidimensional Item Response Theory Package for the R Environment". Journal of Statistical Software. 48(6): 1-29. https://doi.org/10.18637/jss.v048.i06
Choi, S. W., Gibbons, L. E., and Crane, P. K. (2016). Lordif: logistic ordinal regression differential item functioning using IRT. R Package Version, 3-3. https://doi.org/10.18637/jssv039.i08
Connor, K. and Davidson, J. (2003). Development of a new resilience scale: The Connor‐Davidson Resilience Scale (CD‐RISC). Depression and Anxiety, 18, 76–82. https://doi.org/10.1002/da.10113
Costa, G., Salamero, M. and Gil, F. (2007). Validación del cuestionario MOS-SSS de apoyo social en pacientes con cáncer. Medicina Clínica, 128(18), 687-691. https://doi.org/ 10.1157/13102357
Crumbaugh, J., and Maholick, L. (1969). Manual de instrucciones para el Test de Sentido de Vida (PIL). Saratoga: Viktor Frankl Institute for Logotherapy.
Delle Fave, A., Brdar, I., Freire, T., Vella-Brodrick, D. and Wissing, M. (2011). The Eudaimonic and Hedonic Components of Happiness: Qualitative and Quantitative Findings. Social Indicators Research, 100, 185–207. https://doi.org/10.1007/s11205-010-9632-5.
Di Fabio, A. (2014). Meaningful Life Measure: primo contributo alla validazione della versione italiana [Meaningful Life Measure: First Contribution to the Validation of the Italian Version]. Counsel. Giornale Italiano Ricerca Appl, 7, 307-315. http://hdl.handle.net/2158/938535
Du, H.; Li, X., Chi, P., Zhao, J. and Zhao, G. (2017). Meaning in life, resilience, and psychological well-being among children affected by parental HIV. Aids Care, 29 (11), 1410–1416. https://doi.org/10.1080/09540121.2017.13 07923.
García-León, M. A., González-Gómez, A., Robles-Ortega, H., Padilla, J.L. y Peralta-Ramírez, M.I. (2019). Propiedades psicométricas de la Escala de Resiliencia de Connor y Davidson (CD-RISC) en población española. Anales de Psicología / Annals of Psychology. 35(1), 33-40. https://doi.org/ 10.6018/analesps.35.1.314111.
Gras, M.E., Font-Mayolas, S., Baltasar, A. Patiño, J., Sullman, M. and Planes, M. (2019). The Connor-Davidson Resilience Scale (CD-RISC) amongst Young Spanish Adults. Clínica y Salud,30(2),73-79. https://doi.org/105093/ clysa2019a11
Hernández, J. and Betancort, M (2016). ULLRToolbox. http://sites.google. com/site/ullrtoolbox/.
Hochberg, Y. (1988). A sharper Bonferroni procedure for multiple tests of significance. Biometrika, 75, 800–803. https://doi.org/10.2307/2336325.
Horton, T.V. and Wallander, J. L. (2001). Hope and Social Support as Resilience Factors Against Psychological Distress of Mothers Who Care for Children With Chronic Physical Conditions. Rehabilitation Psychology, 46(4), 382-399. https://doi.org/10.1037/0090-5550.46.4.382.
Hu, L. and Bentler, P. (1995). Evaluating model fit. In R.H. Hoyle (Ed). Structural equation modeling: Concepts, issues, and applications. Thousand Oaks, CA, US: Sage Publications, 76-99.
Kleftaras, G. and Psarra, E. (2012). Meaning in Life, Psychological Well-Being and Depressive Symptomatology: A Comparative Study. Psychology, 3 (4), 337-345. https://doi.org/10.4236/psych.2012.34048.
Kline, R. (2011). Convergence of structural equation modeling and multilevel modeling. In M. Williams (Ed.), Handbook of methodological innovation. Thousand Oaks, CA: Sage. http://dx.doi.org/10.4135/9781446268261.n31
Li, F. et al. (2021). Effects of sources of social support and resilience on the mental health of different age groups during the COVID-19 pandemic. BMC Psychiatry 21, 16 https://doi.org/10.1186/s12888-020-03012-1
Liu, Y.; Di, S.; Shi, Y. and Ma, C. (2022). Meaning in life and adolescent self-control: Effect of perceived social support and its gender differences Frontiers in Psychology, 13. https://doi.org/10.3389/fpsyg.2022.1087668
Lozano Díaz, A., Fernández-Prados, J.S., Figueredo Canosa, V. y Martínez Martínez, A.M. (2020). Impactos del confinamiento por el COVID-19 entre universitarios: Satisfacción Vital, Resiliencia y Capital Social Online. International Journal of Sociology of Education, Special Issue: COVID-19. Crisis and SocioeducativenInequalities and Strategies to Overcome them, 79-104.nhttp://doi.org/10.17583/rise.2020.5925.
Machielse, A. (2018). Social isolation, meaning-in-life, and resilience. Innovation in Aging, 2, Issue suppl_1, 25. https://doi.org/10.1093/geroni/ igy023.093
Malçoc, A. and Yalçin, I. (2015). Relationships among Resilience, Social Support, Coping, and Psychological Well-Being among University Students. Turkish Psychological Counseling and Guidance Journal, 5(43) 35-43. https://doi.org/10.17066/PDRD.22119
Martínez, A. E., Sánchez, S., Aguilar, E. J. y Rodríguez, V. (2014). Adaptación y validación del cuestionario MOS de Apoyo Social en pacientes mejicanos con VIH. Revista Latinoamericana de Medicina Conductual, 4(2) 93-101. https://www.redalyc.org/articulo.oa?id=283043156006
Morgan, J. and Farsides, T. (2009a). Measuring Meaning in Life. Journal of Happiness Studies,10,197–214.https://doi.org/10.1007/s10902-007-9075-0.
Morgan, J., and Farsides, T. (2009b). Psychometric evaluation of the meaning in life measure. Journal of Happiness Studies, 10, 351–366. https://doi.org/ 10.1007/s10902-008-9093-6.
Morgan, J., and Robinson, O. (2012). Intrinsic Aspirations and Personal Meaning Across Adulthood: Conceptual Interrelations and Age/Sex Differences. Developmental Psychology. Advance online publication. https://doi.org/10.1037/a0029237.
Muñiz, J., Elosua, P. and Hambleton, R. K. (2013). Directrices para la traducción y adaptación de los tests: segunda edición. Psicothema, 25(2), 151-157. https://doi.org/ 10.7334/psicothema2013.24.
Newsom, J. T. (2015). Longitudinal structural equation modeling: A comprehensive introduction. Routledge.
Revelle, W. (2019) psych: Procedures for Personality and Psychological Research, Northwestern University, Evanston, Illinois, USA, https://CRAN. R-project.org/package=psych. Version = 1.9.12.
R Core Team (2016). R: A language and environment for statistical computing. Vienna, Austria. R Foundation for Statistical Computing.
Rosseel, Y. (2012). Lavaan: An R Package for Structural Equation Modeling. Journal of Statistical Software, 48(2),1-36. https://doi.org/10.18637/ jss.v048.i02.
Ryff, C. D. (1989). Happiness is everything, or is it? Explorations of on the meaning of psychological wellbeing. Journal of Personality and Social Psychology, 57, 1069-1081. https://doi.org/10.1037/0022-3514.57.6.1069.
Schmid, J., and Leiman, J. M. (1957). The development of hierarchical factor solutions. Psychometrika, 22(1), 53-61.https://doi.org/10.1007/BF02289209
Sherbourne, C. D. and Stewart, A. L. (1991). The MOS Social Support Survey. Social Science and Medicine, 32(6), 705-714. https://doi.org/10.1016/0277-9536(91)90150-b.
Southwick and Charney (2018) «Perfiles de Resiliencia», In N. E. Kuarez, Munist, M., Kotliarenco, M. A. (Eds.), Resiliencia tendencias y perspectivas. Argentina: Fundación Bernard van Leer. UNLA.
Tsibidaki, A. (2021). Anxiety, meaning in life, self-efficacy and resilience in families with one or more members with special educational needs and disability during COVID-19 pandemic in Greece. Research in Developmental Disabilities, 109, 103830
Vaziri, S., and Lotfi, A. A. (2017). Contributing allocation of meaning of life and perceived social support in coping with the pain. Developmental psychology (Journal of Iranian Psychologists), 13(52), 375-382. https://www.sid.ir/en/journal/ViewPaper.aspx?id=549960.
Wang, Z., and Xu, J. (2017) Association Between Resilience and Quality of Life in Wenchuan Earthquake Shidu Parents: The Mediating Role of Social Support. Community Mental Health Journal, 53(7), 859-63. https://doi.org/10.1007/s10597-017-0099-6.
Weathers, L. N., Aiena, B. J., Blackwell, M. A. and Schulenberg, S. E. (2016). The significance of meaning to conceptualizations of resilience and posttraumatic growth. In P. Russo-Netzer, S. E. Schulenberg, and A. Batthyany (Eds.), Clinical perspectives on meaning: Positive and existential psychotherapy (149–169). Springer International Publishing AG. https://doi.org/10.1007/978-3-319-41397-6_8
Weber, M. C., Pavlacic, J. M., Gawlik, E. A., Schulenberg, S. E., and Buchanan, E. M. (2020). Modeling resilience, meaning in life, posttraumatic growth, and disaster preparedness with two samples of tornado survivors. Traumatology, 26(3), 266–277. https://doi.org/10.1037/trm0000210
Zhang, L., Jiang, M., Wang, L., Zheng, J. and Wang, W. (2023). The Mediating Effect of Perceived Social Support and Medical Coping Modes Between Psychological Resilience and Meaning in Life in COVID-19 Patients. Patient Preference and Adherence,17, 571 -582.